By: Bart Borg, Ph.D.
Optimizing corn particle size is one of those “must be’s” that easily fits into the category of “the basics”, but it is not top of mind every day and can easily get off track. The potential negative financial impact, especially at $6.50/bu corn, stacks up there with the costliest of mistakes. It impacts every pig being fed, on every day of the grow-out. It also is one of the easiest things to monitor. In this article, you’ll read examples of the cost impact of changing corn particle size, as well as ideas around testing and monitoring, and establishing a target for your feeding operation and mill.
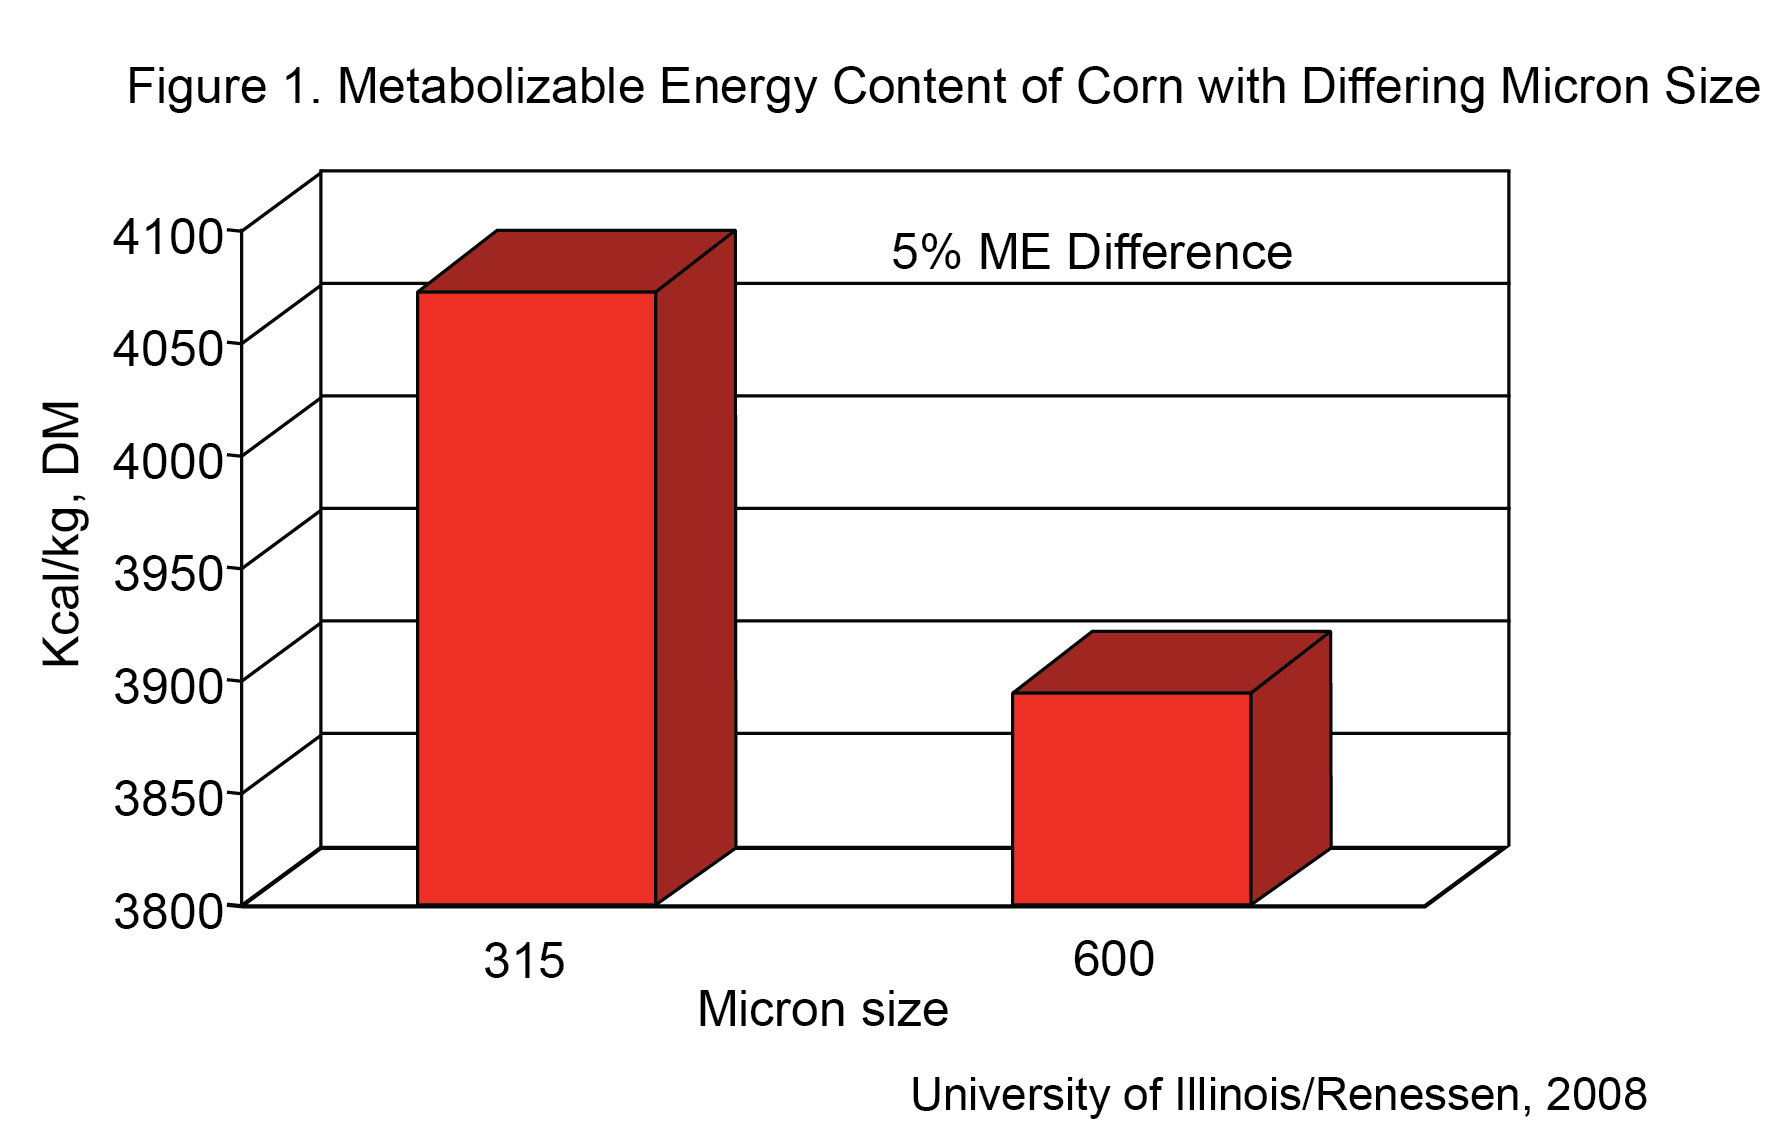
The concept behind why particle size matters comes down to digestibility of the corn or grain portion of the diet. Up to a point, the digestion of corn will continue to improve with every increment of grinding finer. As corn is our primary energy source in the diet, the finer the corn is ground, the better it is digested and therefore, more energy extracted from the corn. Figure 1 provides an example of the difference in metabolizable energy that is utilized when pigs were fed diets with two different corn particle sizes. As you can see, pigs fed the 315-micron corn were able to harvest 5% more metabolizable energy from the corn than those eating a diet with 600-micron corn. The interesting thing is that the 315-micron corn cost the same per bushel as the 600-micron corn, and so lies the opportunity to capture the value of optimizing corn particle size.
MEASURING PARTICLE SIZES
Corn particle size is expressed in microns. To contextualize this for you, there are 25,400 microns in an inch and human hair is around 70 microns thick. Practical corn particle size will commonly range from 250 microns (pelleted feeds ground by hammer mill) to 800 microns. I would suggest that most meal feed should have a corn micron size of around 525 microns. This varies due to grinder type (i.e., hammer mill or roller mill), season of the year, other alternative ingredients being used, feeder type and willingness to periodically tap on the bin to get feed flow started. Many of the variables I just noted have to do with feed flow, as the decision balance of optimum particle size will primarily come down to the desire and need to maintain feed flow.
Figure 2. Pictures of various corn particle sizes and tools used for measuring particle size
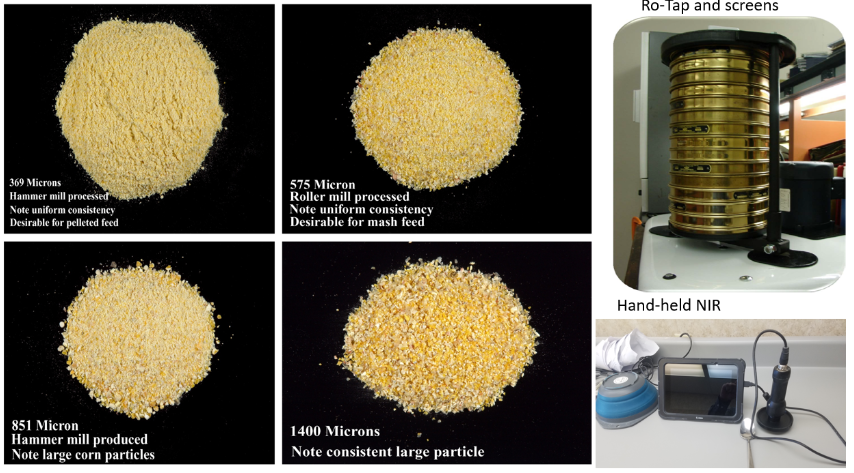
There are two primary methods used to measure particle size. The first is with the Ro-Tap machine and set of pans with various screen sizes, and the second is through Near Infrared Spectroscopy (NIR). Either works well but it is important that once you begin to measure particle size, you continue to use the same method. There is often slight variability between the two methods, so results can be confusing if you go back and forth between methods. Another important point for particle size is to make sure you know if the lab conducting the measurement is using a flow agent or not. In some labs, a flow agent is used to help the corn particles work their way through the series of screens used on the Ro-Tap. Use of a flow agent will normally provide a result that is about 75 microns lower than no flow agent. Again, either way works, but it is important to stick with one method so you have consistency when comparing your results.
Another data point from a particle size analysis to understand is the variation in particle size around the average. This measure is expressed as the geometric standard deviation and a good target is approximately 2.2. Although you can expect a slightly higher standard deviation when a flow agent is used. As you can imagine, a corn sample could be a mix of very fine powder and large chunks of corn and still be an average of 500 microns. For this reason, standard deviation is also measured and monitored. Roller mill corn normally will have a lower standard deviation than hammer mill corn which is one of the reasons that when feeding meal feed, roller mill ground corn is preferred. Roller mill ground corn will flow better at a lower average micron size due to less variation in particle size and the difference in particle shape, as roller mill ground corn is more spherical than hammer mill corn. Testing a minimum of 1 sample per week has a great potential return in value, especially considering corn micron size is not expensive to analyze.
ESTABLISHING A TARGET
Establishing a target micron size for the mill is important but can be difficult. The value of lower micron size needs to be weighed against the potential of getting too low in particle size and creating feed flow challenges. I’d encourage anyone working through this to establish a solid communication path from those in production. They will be your best source of information on feed flow to the mill employees that are responsible for monitoring corn particle size and adjusting machinery accordingly. As indicated earlier, season of the year, other ingredients etc. will cause the target micron size to change from time to time. Keeping an open line of communication from production to the mill will help you optimize the particle size year-round.
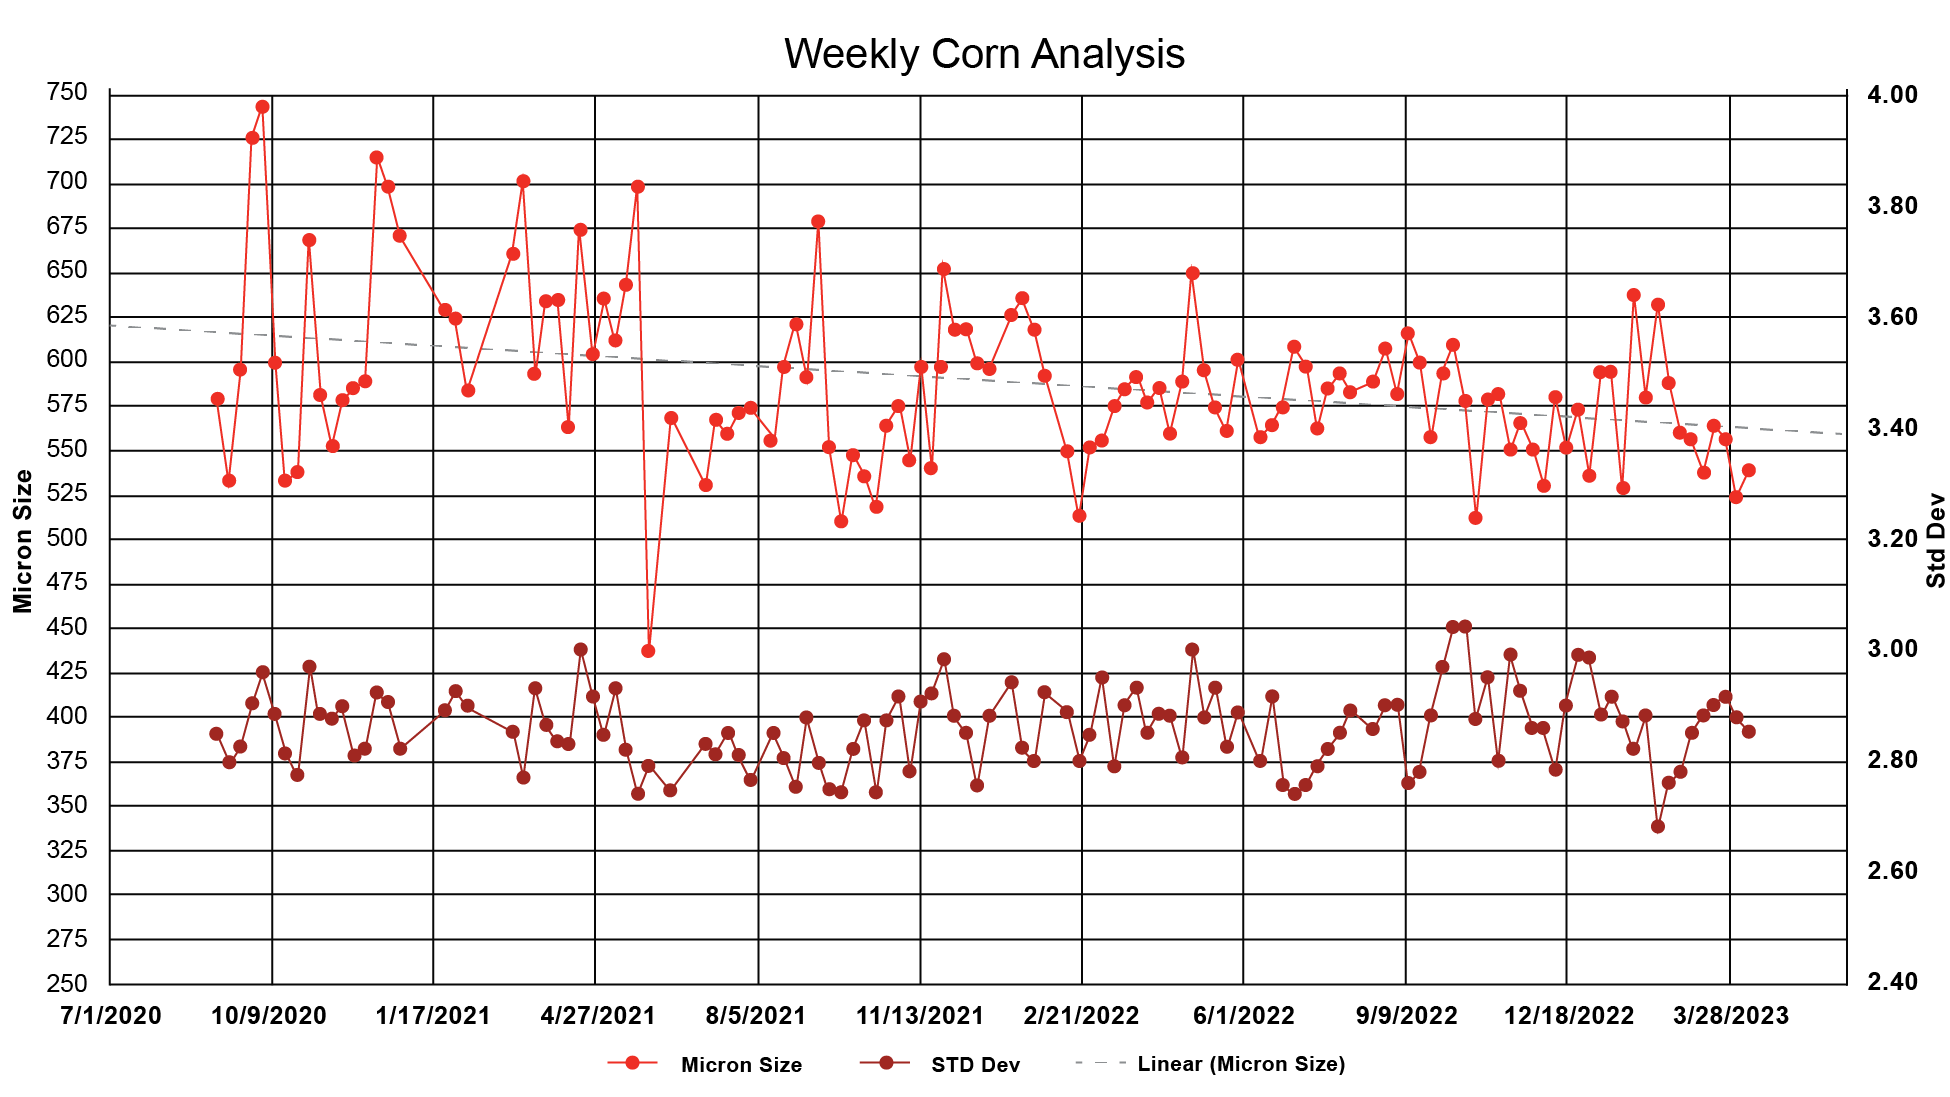
One last suggestion is to create a run chart of the results so you can monitor how corn micron size may need to change from season to season, at time of corn harvest, with various levels of alternative ingredients etc. Putting the weekly results in a chart with a date connected to it will make the entire team smarter as you manage the particle size target. An example of this is shown in Figure 3.
WHY IT MATTERS
Corn particle size is one of the easiest and greatest cost impact adjustments that you can make. As described earlier, the value comes in the additional energy that the pig will obtain, through improved digestion, as corn is more finely ground. In the simplest sense, better digestibility means improved feed conversion and thus improved cost of feeding the pig. The best part is that the corn you’re grinding finer doesn’t cost any more per bushel than if you fed it as whole kernels. Figure 4 shows the feed conversion change for a finishing pig over a wide range of particle sizes. In this study and graphical summary, for every 100 microns of corn particle size change, the feed conversion will be impacted by 4 points. In other words, if your feed conversion is now at 2.7, by reducing the corn particle size by 100 microns you would expect to see feed conversion drop to 2.66. That may seem like a small change and not worth the squeeze, but the importance becomes very visible when you turn that into the dollars and cents of raising pigs.
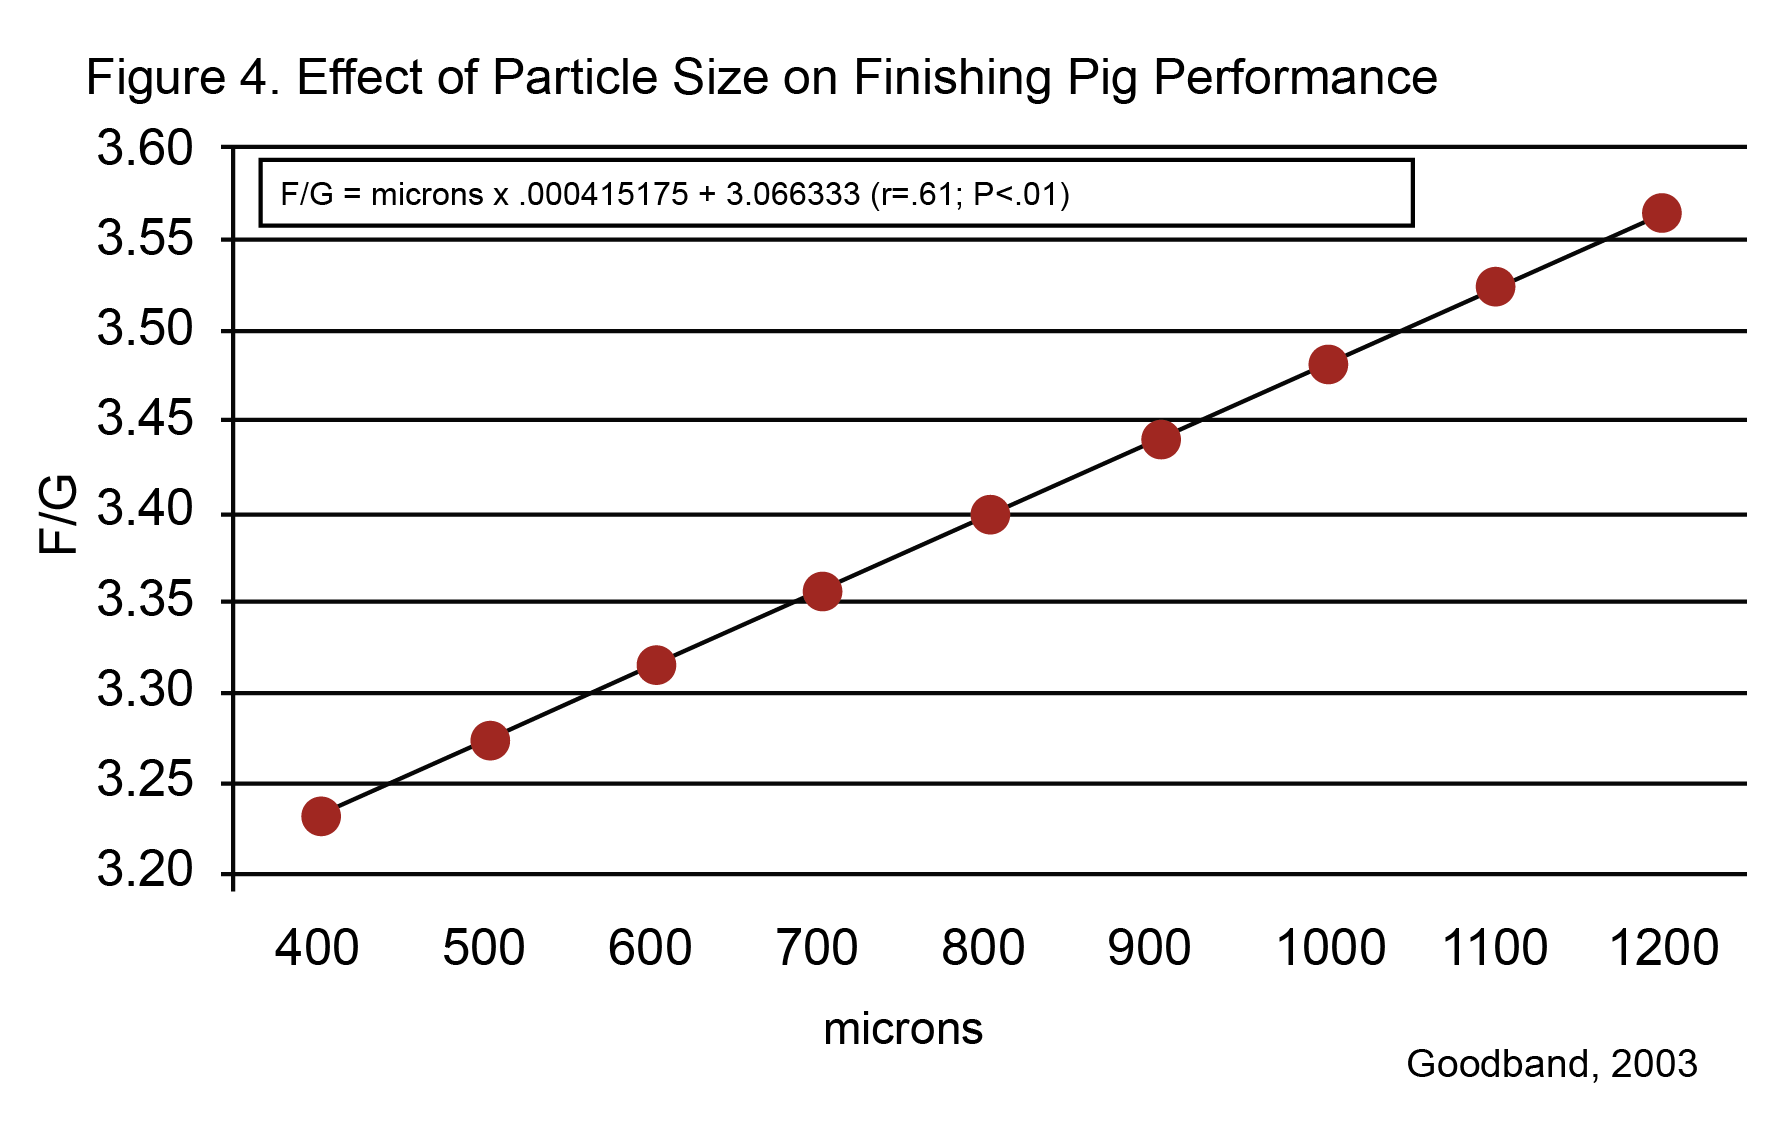
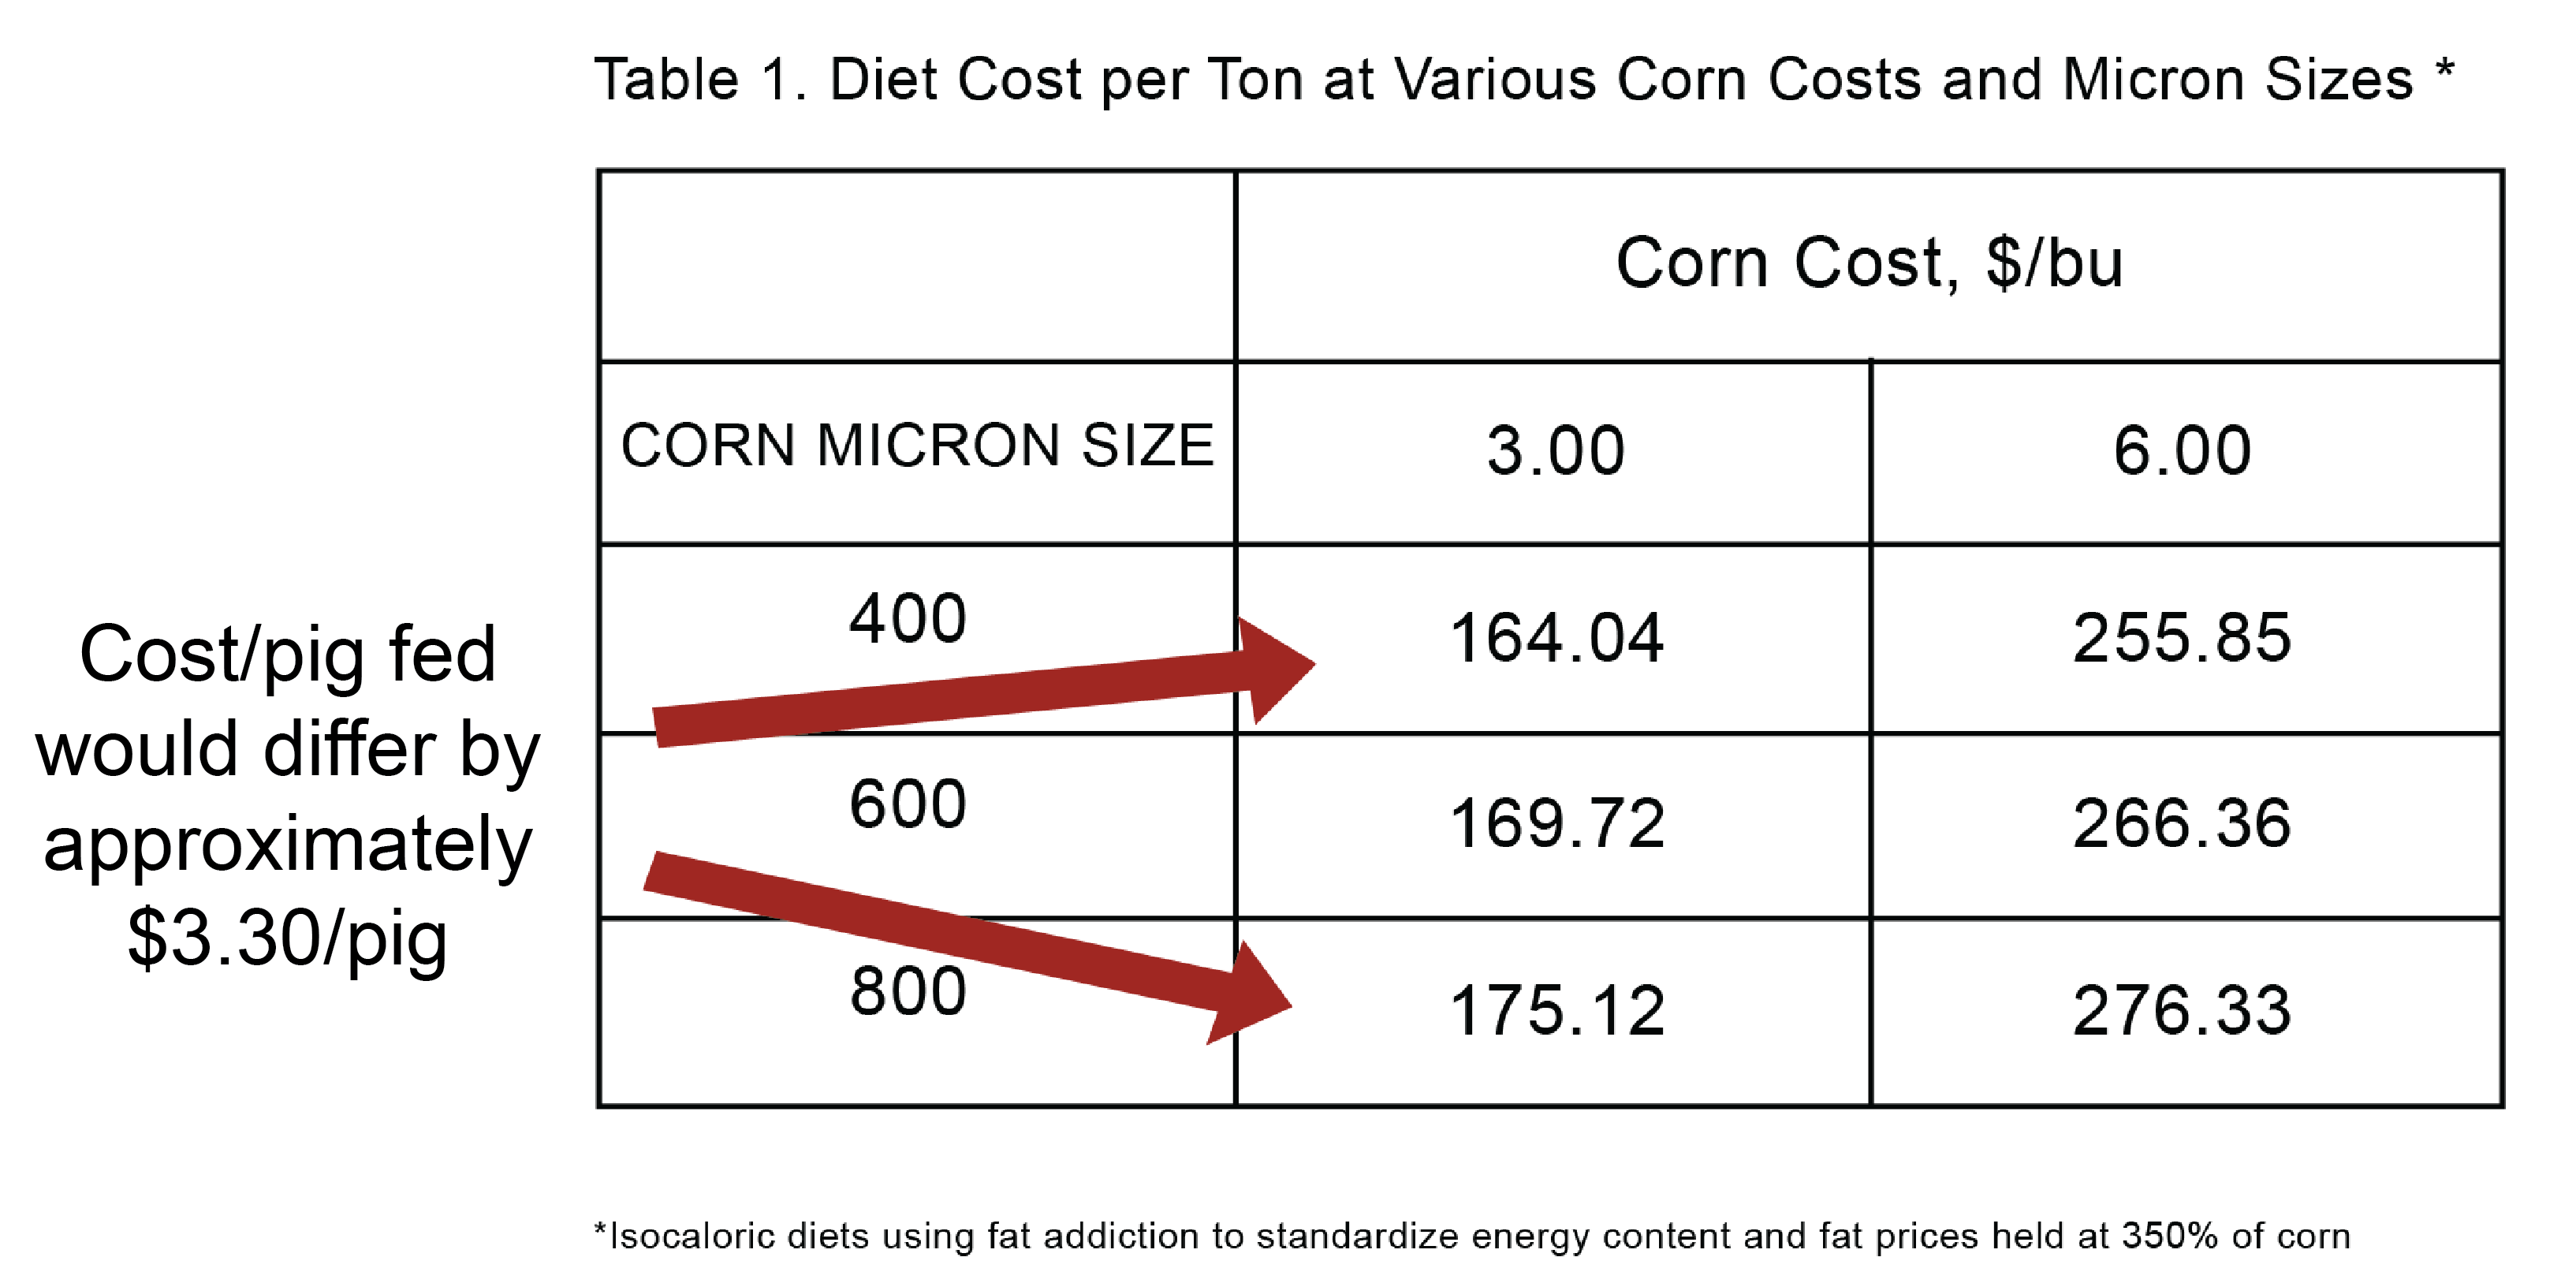
Table 1 below outlines the cost of a ton of finishing feed at various corn micron sizes. These various diets are formulated to provide the same level of gain and feed conversion, so it’s easy to just take the formula cost difference and divide it by 3 (1 ton will feed approximately 3 pigs). Highlighted here you can see the cost per pig fed would differ by approximately $3.30/pig when looking at the 400-micron difference between 400 and 800 at $3/bu corn. That can make a huge difference in overall cost to feed. You can use the information in the table as a tool to calculate the approximate value of a micron change. Another key factor to keep in mind is that as corn prices go up, so does the value of each micron adjustment. A comparison of $3/bu vs $6/bu corn is also provided in the table.
Hopefully, this information has provided you tools that will allow you to tighten up the activities around this aspect of feed quality assurance. If you have questions about this article or other nutrition, production, and milling aspects of your operation, please reach out to us or your Standard Nutrition Services consultant.
